Blog / Your day is not a pie chart
Essay
Your day is not a pie chart
Disagree, or see it differently? Write to founders@dtangle.ai → · PDF
Where did the day go?
Ask anyone who works at a computer where yesterday went and you will get a story. It will be confident, tidy and mostly wrong. Not because people lie, but because a day at a screen does not happen in the shape we remember. It happens in pieces.
Activity tracking was supposed to fix that. For twenty years apps have promised to show you your own day. Most of them hand you a pie chart. This essay argues that a pie chart is the wrong picture of a working day and sketches a better one.
What a tracker shows
- Chrome2h 40m39%
- VS Code1h 50m27%
- Slack1h 20m20%
- Zoom40m10%
- Notion20m5%
Productivity score 64/ 100
Five apps and a score. Nothing about what any of it was for.
What the day was
-
BuildBilling webhook fix3h 05m
VS Code, Chrome, Slack
-
PlanQ4 planning1h 25m
Notion, Chrome, Zoom
-
CoordinateTeam syncs1h 05m
Slack, Zoom
-
LearnA Postgres indexing talk30m
Chrome
-
DistractedNews and video45m
Chrome
Why it matters
In 2004 Gloria Mark's team at UC Irvine followed office workers with stopwatches. On average they stayed on one screen for two and a half minutes before switching. Logging software later put the figure at 75 seconds in 2012 and 47 seconds in 2016.11Mark, G. Attention Span: A Groundbreaking Way to Restore Balance, Happiness and Productivity. Hanover Square Press, 2023. Switching is not free. A study of 137 people at three Fortune 500 companies counted close to 1,200 toggles between apps and websites a day, costing just under four hours a week in reorienting: about 9% of a working year.22Murty, Dadlani, Das. How Much Time and Energy Do We Waste Toggling Between Applications? Harvard Business Review, 2022. Microsoft's own telemetry puts interruptions by meetings, email and chat at one every two minutes of core work hours, 275 a day, for its most pinged users.33Microsoft WorkLab. Breaking Down the Infinite Workday. Work Trend Index special report, 2025.
Average time on one screen before switching
None of it is visible from the inside. People asked to estimate their own screen use are rarely accurate: across 106 comparisons with logged data, self reports agreed only moderately.44Parry, Davidson, Sewall, Fisher, Mieczkowski, Quintana. A systematic review and meta-analysis of discrepancies between logged and self-reported digital media use. Nature Human Behaviour, 2021. We misremember which hours were deep and which were scattered, so the advice we take is aimed at a day we imagined.
That is the case for tracking. Nothing you have is more important than your attention. It decides what gets built, what gets learned and what a day was for. It is also the one input nobody measures well. You cannot protect what you cannot see.
Five ways it goes wrong
The tools exist. They fail in five recognizable ways.
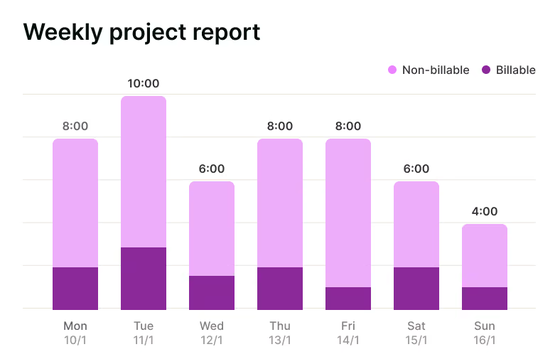
Timers make you the bookkeeper. Start a timer, name the task, stop it, repeat a dozen times a day. A timer records what you meant to do, not where your attention went. The moment it becomes a chore you stop. Researchers who study self tracking call this lapsing and find it is the normal life of a tracker, not a personal failing.55Epstein, Ping, Fogarty, Munson. A Lived Informatics Model of Personal Informatics. UbiComp, 2015.
9:00 to 11:00, logged and lived
The timerWrite the Q4 spec
What happened
9:009:3010:0010:3011:00
- The spec 1h 13m
- Messages and email 23m
- News and video 24m
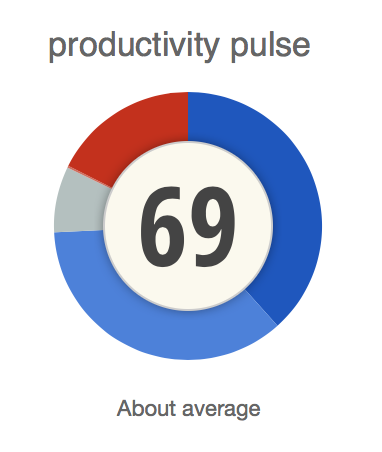
Dashboards count apps, not work. Automatic trackers remove the bookkeeping, then file every minute under the app it happened in and grade the app from a list. RescueTime boils that down to a Productivity Pulse, one number from 0 to 100 averaged from the grade each app was given in advance.66RescueTime. How is my Productivity Pulse calculated? RescueTime help center. But the same browser is research at ten and a detour at eleven. The same chat window is coordination one hour and escape the next. Two hours of "Chrome" is not a finding. Work runs in threads that cross apps, so slicing a day by app cuts every thread into confetti.
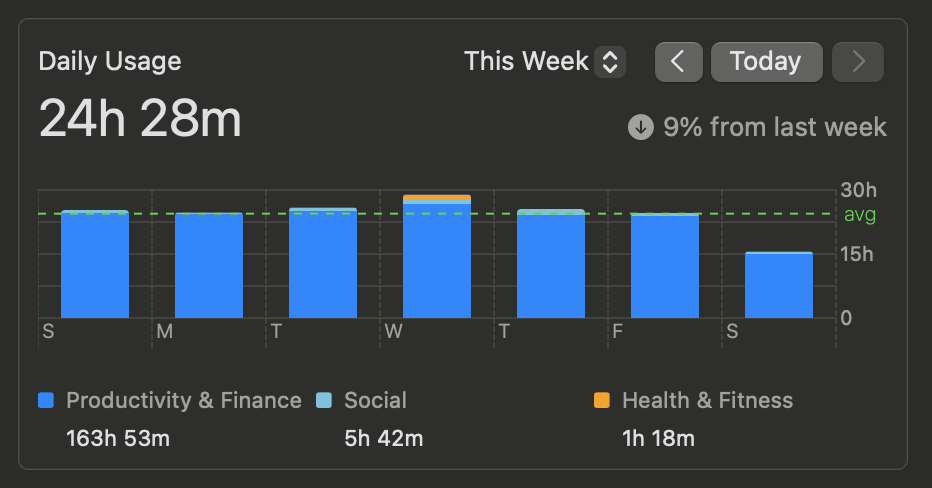
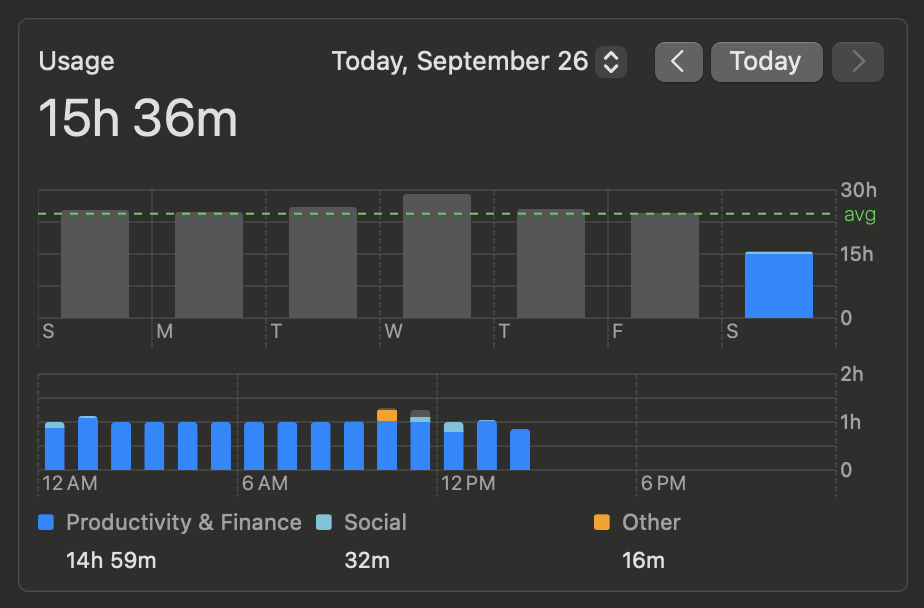
Screen time gives totals without a story. Here is my own Mac. Over one week it reports a daily average of 24 hours 28 minutes, longer than the days it was measuring. It files almost all of it under one label: Productivity & Finance, 163 hours. In the day view every hour since midnight holds a full hour of use, 15 hours by mid afternoon. Was that code, email, a spreadsheet or a build left running? It cannot say. A total with an arrow next to it tells you that something changed, never what or why.
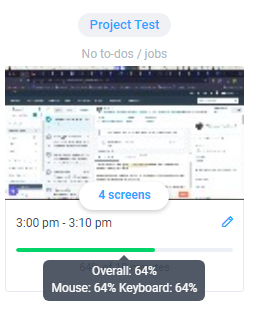
Bossware points the camera the wrong way. Much of the tracking sold today is bought by employers to watch people, not by people to understand themselves. About a third of UK employers already use it to log browsing, email and screen activity.77Chartered Management Institute survey, reported in Third of UK firms deploy bossware to track staff activity. People Management, 2025. Much of it scores you on motion: Hubstaff's activity rate is the share of seconds in each ten minutes with any keyboard or mouse input.88Hubstaff. What does the desktop timer application track? Its AI is sold to managers: AI-powered workforce analytics. Motion is easy to fake. In 2024 Wells Fargo fired more than a dozen people for "simulation of keyboard activity."99Wells Fargo Fires Over a Dozen for "Simulation of Keyboard Activity". Bloomberg, 2024. Tracking that can be used against you is tracking you learn to route around.
Ten minutes, scored by keyboard and mouse
Reading a design doc, then replying
30%activity
A mouse jiggler, nobody at the desk
100%activity
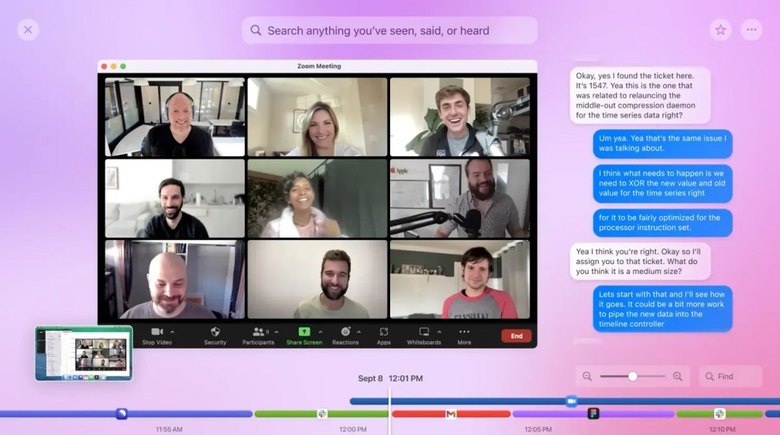
Recording everything is a haystack. Capture the screen every few seconds, make it searchable and call it memory. You can find the moment you saw something. You still cannot see the shape of your day. And a memory kept inside someone else's product lasts as long as the product: Rewind stopped capturing on December 19, 2025, two weeks after its maker was acquired.1010Rewind Mac app shutting down following Meta's acquisition of Limitless. 9to5Mac, 2025.
Underneath all five is the same gap. They sort by rule: an App Store category, a list of grades, a count of keystrokes. None of them reads what the work was. Where AI has arrived it serves the manager's analytics or searches a recording. It never tells you what your day was about. Each one either asks you to do the analysis or hands you raw material and walks away.
The ones that came before
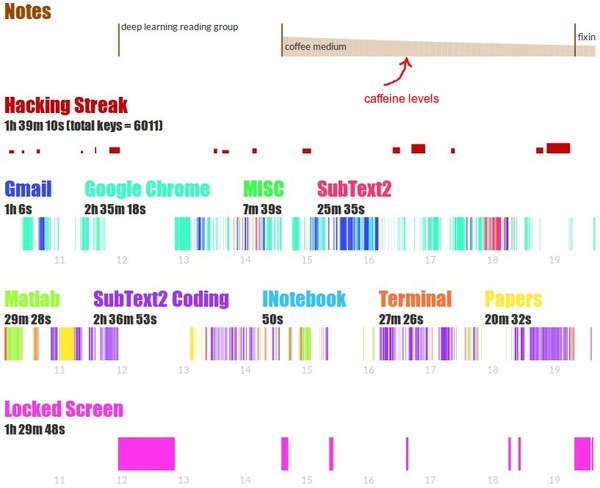
The most honest attempts came from engineers scratching their own itch. Andrej Karpathy's ulogme logged window titles and keystrokes on his own machine, because a record of everything he did felt too private for someone else's server, then drew his days as timelines.1111Karpathy, A. Quantifying Productivity. 2014. The code: ulogme. Sourcegraph's Thyme set out to measure human time and focus from the terminal.1212Sourcegraph. Thyme: automatically track which applications you use and for how long. 2016, archived. Both were open source. Both kept the data at home. Both have since gone quiet.
They proved that logging is the easy part. What they left to you was the reading: you were still the analyst of your own day, staring at a chart and deciding what it meant.
What we built instead
At dtangle we took a different bet on productivity. We felt it starts with attention: not the hours you logged or the apps you opened, but where your attention went and what pulled it away. So we built it in layers.
dtangle runs quietly on your Mac and in your browser, with nothing to start or label. AI turns the raw minutes into strands of work, each built from whatever apps it took. It keeps track of how they connect: what interrupted what, what is still open from yesterday. Every morning it reads yesterday back to you in five lanes. Through the day it coaches gently, with the hours worth protecting and a drift caught while there is still time. A working day that stays under 20% distracted lights a strand. Five braid into a band.
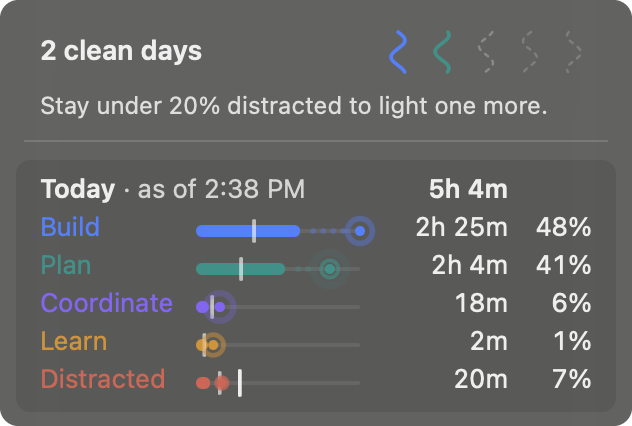
There is no leaderboard and no team average. Your baseline is you: your usual for this weekday, your clean days, your bands. Someone else's day says nothing about yours. It is you against yourself. The only fair comparison is with the person you were last Tuesday.
It is yours, too. It is not a manager's dashboard. You can delete any day, on every device, whenever you like.
We call this detangling. Attention arrives tangled. A tracker's job is not to count the knots but to show you which thread to pull. That is the bet behind dtangle. This is the first of what we will write about it.
Cite this article
@misc{appalaraju2026piechart,
  title        = {Your day is not a pie chart},
  author       = {Appalaraju, Srikar},
  year         = {2026},
  howpublished = {https://www.dtangle.ai/blog/your-day-is-not-a-pie-chart}
}